7 Free websites for Site Analysis in Architecture (2026 Guide)
- 3 min read
- February 23, 2026

If you’re still doing architectural site analysis by stitching together screenshots, Google Earth guesses, or manually tracing context maps, there’s a better way.
Today, real-time data and free GIS-based tools can significantly improve the accuracy and clarity of your early-stage drafting work. And the best part? You don’t need expensive software. Below are 7 free websites for site analysis in architecture that can make your feasibility studies, concept diagrams, and drafting workflows faster and more defensible.
1. Ventusky – Wind & Climate Visualization
Ventusky is one of the most useful free tools for understanding wind patterns, temperature, rainfall, and climate behavior.
For architects, this is especially valuable during:
- Early orientation studies
- Natural ventilation planning
- Thermal comfort considerations
The animated wind overlays help you visualize prevailing wind directions instead of relying on static data. With updated historical climate exports (2026 data), you can back up your passive design decisions with actual environmental context. For drafting teams preparing feasibility diagrams, this makes your site response more defensible.
Best for: Wind analysis, Ventilation studies, and climate-responsive design.
Explore Ventusky
2. OpenStreetMap – Free Urban Context Data
OpenStreetMap provides free, editable vector data for roads, buildings, and land use layers. Unlike static maps, you can control visibility and export clean base files for refinement inside CAD or Illustrator.
For drafting teams, this eliminates hours of manual tracing. It’s particularly useful when building context diagrams or early-stage site documentation that needs to remain editable throughout the project lifecycle.
Best for: Base maps, urban context diagrams, and master planning groundwork.
Explore OpenStreetMap
3. Snazzy Maps – Presentation-Ready Site Diagrams
Even technically accurate site analysis can fall flat if the diagrams look cluttered. Snazzy Maps lets you customize map colors, simplify visual noise, and generate clean presentation-ready backgrounds. This is particularly helpful when preparing client-facing documents where clarity matters just as much as accuracy. Instead of overworking graphics manually, you can start with a cleaner base.
Best for: Client presentations, competition boards, visually refined context diagrams.
Explore Snazzy Maps
4. Cadmapper – Instant CAD Site Models
Cadmapper continues to be one of the most reliable free tools for architectural site modeling. It allows you to download up to one square kilometer of CAD data, including building footprints, roads, and contours.
For drafting workflows, this is a massive time saver. Instead of building a base model from scratch, you can import accurate geometry directly into AutoCAD, Revit, or SketchUp and begin massing studies immediately.
Best for: Quick site modeling, contour imports, early massing studies.
Explore Cadmapper
5. Aino World – AI-Powered GIS Insights
Aino World introduces AI-driven analysis into architectural workflows. Instead of manually compiling GIS layers, you can generate insights about sun exposure, terrain variation, demographic trends, and wind behavior through automated tools. This makes it especially useful during urban-scale feasibility or conceptual masterplanning. It reduces research time while still producing visuals that strengthen your design rationale.
Best for: Early feasibility studies and AI-assisted site evaluation.
Explore Aino World
6. Shadowmap – Real-Time Sun & Shadow Studies
Shadowmap provides real-time 3D solar analysis, allowing you to study seasonal sun paths, façade irradiance, and overshadowing impacts. For architects concerned with passive solar design or local regulations around shadow impact, this tool makes environmental performance easier to visualize and communicate. It bridges the gap between conceptual design and environmental validation.
Best for: Solar studies, overshadowing analysis, passive design validation.
Explore Shadowmap
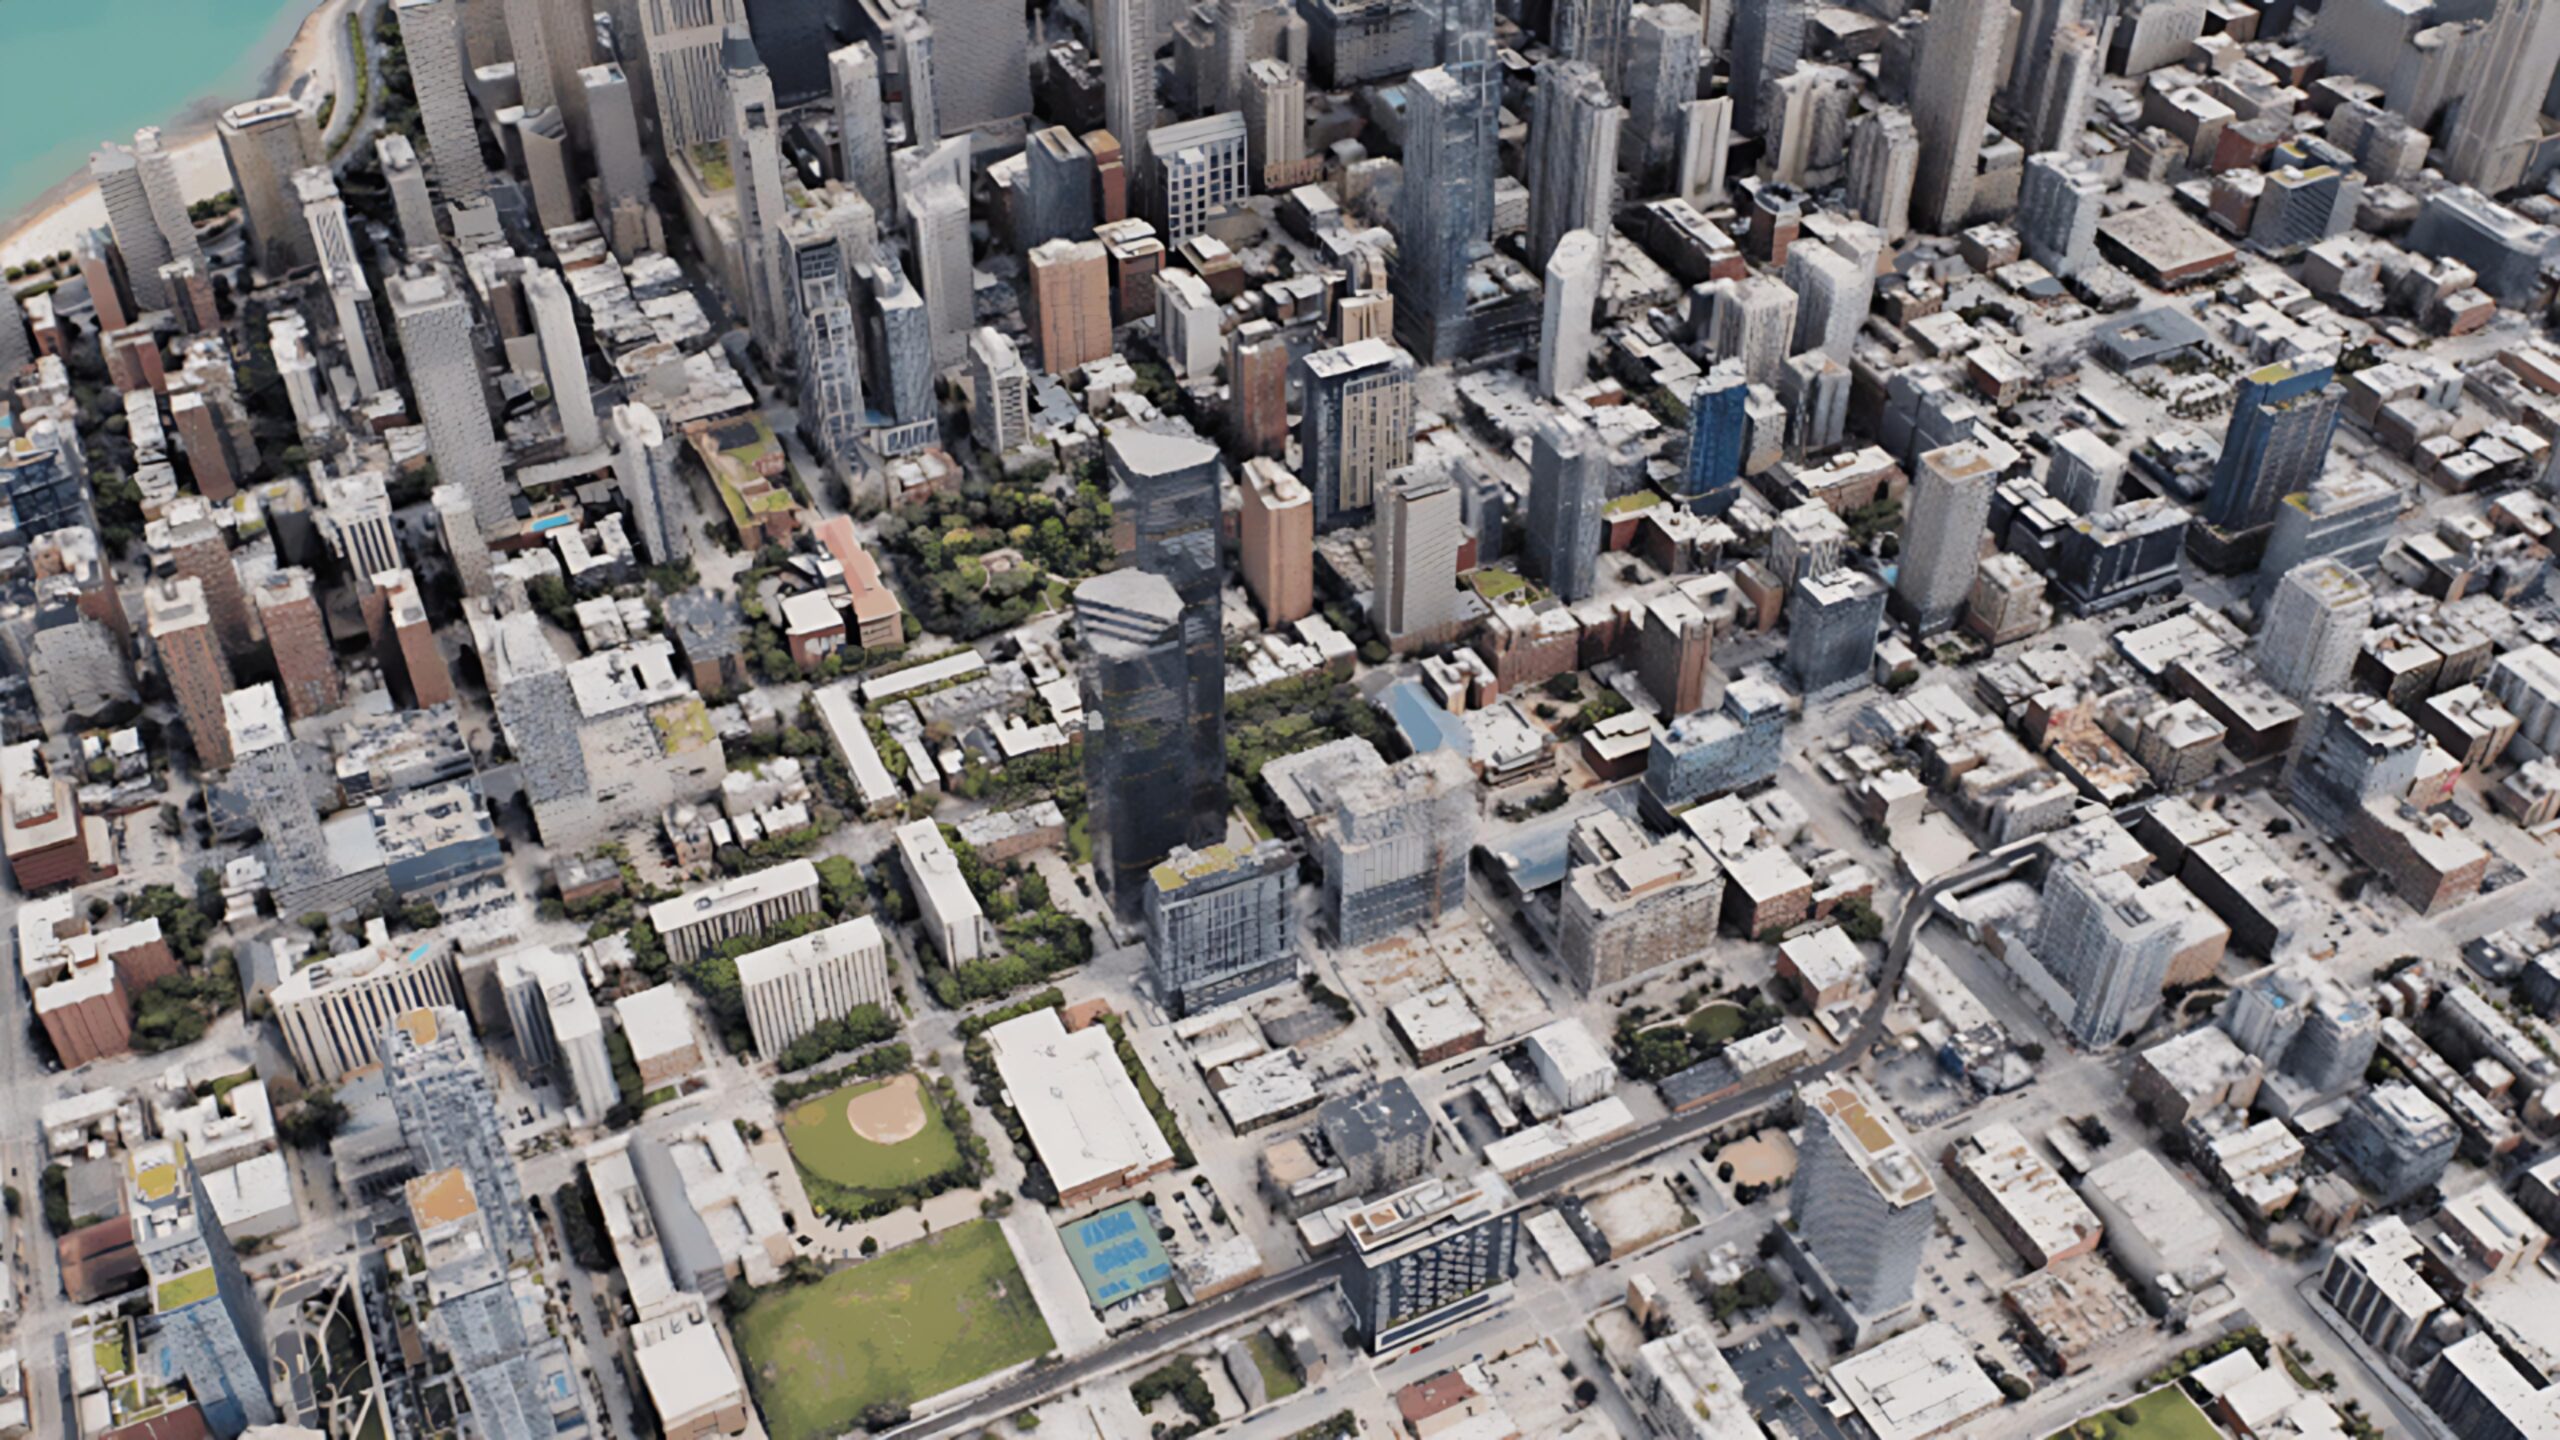
7. Luminocity3D – Urban Density & Built Form Insights
Luminocity3D allows architects to visualize 3D building data, population density, and urban growth trends across cities. Instead of manually compiling data from multiple sources, you can quickly understand surrounding massing patterns, scale relationships, and development intensity.
For drafting teams working on mixed-use, commercial, or masterplanning projects, this tool helps justify height strategies, FAR assumptions, and contextual massing decisions with real data.
Best for: Urban planning, demographic context, and large-scale site narratives.
Explore Luminocity3D
Wrapping Up
Strong architectural site analysis is no longer about assembling disconnected screenshots. It’s about building a clear, data-informed foundation for drafting and design decisions. When integrated thoughtfully, even a few of these free site analysis tools can significantly improve accuracy, reduce drafting time, and strengthen your feasibility documentation.
If your team is aiming for faster turnarounds and more defensible design proposals, incorporating these platforms into your drafting workflow is a practical first step!
Enjoyed this post?
Explore more resources here or book a quick strategy call to learn how MGS Global Group can support all your drafting needs!